Gemini CLI:CSV 转Streamlit 应用
现在,想象一下,你把一个 CSV 文件拖进一个文件夹,然后在提示符下输入“start”。三十秒后,一个 Streamlit 应用就会在你的浏览器中运行。
听起来可能有点耳熟?
- 获取新的数据集。
- 启动一个 Notebook。
- 导入 Pandas、Matplotlib、Seaborn……等等。
- 编写与上次类似的分析代码。
- 生成之前已经写过无数次的旧可视化效果。
哎呀!不太对劲。深入研究 Python 代码,找出需要修改的地方,然后重新运行 Notebook。
这并不是说它很难,只是有点繁琐。
最终你会得到一个 Jupyter Notebook,里面有表格和图表,其中穿插着 Python 代码,虽然它能满足你的要求,但不太适合展示给客户。
现在,想象一下,你把一个 CSV 文件拖进一个文件夹,然后在提示符下输入“start”。
三十秒后,一个 Streamlit 应用就会在你的浏览器中运行。它会显示一个简洁的交互式仪表板,其中包含数据集预览、汇总统计信息和直方图,所有这些都无需你修改任何代码。
类似这样:
如果这不是你想要的,只需告诉它,它就会进行相应的更改。
这就是我一直在尝试使用 Gemini CLI 及其秘密武器:GEMINI.md 的想法。
1、核心理念
Gemini CLI 是一个命令行工具,可让你直接从终端与 Google 的 Gemini 模型进行交互。但真正的强大之处在于 GEMINI.md,这是一个充当持久指令集的 Markdown 文件。它就像给 AI 贴了一张永久的便签,上面写着:
“每当我要求你在这个项目中做某事时,请遵循这些规则和偏好。”
利用它,我们可以创建一个管道:
- 接受 CSV 文件作为输入。
- 使用 uv 设置虚拟环境。
- 生成自定义的 Streamlit 应用进行数据分析。
- 自动运行该应用——随时可以进行交互式探索。
- 随时可以接受修改分析的指令并立即执行。
最棒的是?您可以根据自己的喜好,将 GEMINI.md 中的指令设置为固定或自适应。您可以对每个分析步骤进行硬编码……或者您可以告诉 Gemini 先提出一个计划,等待您的反馈,然后再编写应用代码。
换句话说,这不仅仅是自动化——而是在您需要时,有人参与的自动化。
让我们来看一个例子。
2、自动分析 CSV 数据
为了进行本次实验,我使用 Gemini 提出了一个分析方案。
GEMINI.md 文件如下所示:
# Project overview

You are helping to automate a data analysis workflow using the Gemini CLI.
You should:

1. Accept a CSV file. Unless otherwise stated, this will be in the folder
'data'.
2. Propose a plan to analyse the given data.
3. The proposed plan should be presented to the user and can either be accepted as is or with modifications.
4. Generate a Streamlit app that implements the plan.
5. Use the 'uv' package manager to create and manage a virtual environment.
6. Automatically run the generated Streamlit app after setup.
7. Accept additional instructions to modify the running app.

# Workflow details

- Virtual environment name: '.venv' created using 'uv init'.
- Install dependencies: 'pandas', 'streamlit', 'Plotly' and any other libraries that are necessary using 'uv pip install <library>'
- Use Python 3.11 unless specified otherwise.
- Write all code into 'app.py' in the current directory.
- All charts are to be implemented using Plotly.
- The app should be run with the command: 'start uv run streamlit run app.py' (this will start a subprocess in Windows that will allow modification to run immediately)
- All tables should be displayed using Streamlit 'st.dataframe'.
- Use Streamlit user interface components to seperate the data views and navigation.

# Style preferences

- Code must be clean and modular. Use PEP8 formatting.
- Keep imports grouped at the top.
- Add clear inline comments explaining each major step.
这描述了数据分析的通用流程,几乎可以用于任何数据文件。它用浅显易懂的英语写成,所以应该很容易理解。
我将文件分为三个部分:第一部分是工作流程概述,其中包括 Gemini 将提出一个计划,用户可以根据需要进行修改。第二部分提供了设置环境和构建应用程序的具体指导;第三部分确保代码结构合理并遵循 PEP8 风格指南。
那么,如何使用它呢?
- 安装 Gemini。安装过程很简单,但您需要先在系统上安装 Node。完整的说明可以在 Gemini 的 GitHub 仓库中找到,因此我就不在这里赘述了。虽然 Gemini 提供了如何获取和使用 API 密钥的说明,但您不需要。Gemini 有一个免费套餐,无需注册。结构清晰,并提供了充足的操作空间,因此您可以忽略 API 密钥相关的内容。
- 为您的项目创建一个新的空文件夹,并在其中创建 GEMINI.md 文件(如果您愿意,可以剪切并粘贴我的文件)。接下来,在您的项目文件夹中创建一个数据文件夹,并将您的 CSV 文件放入其中。
- 在 PowerShell 的命令行中,输入 Gemini。
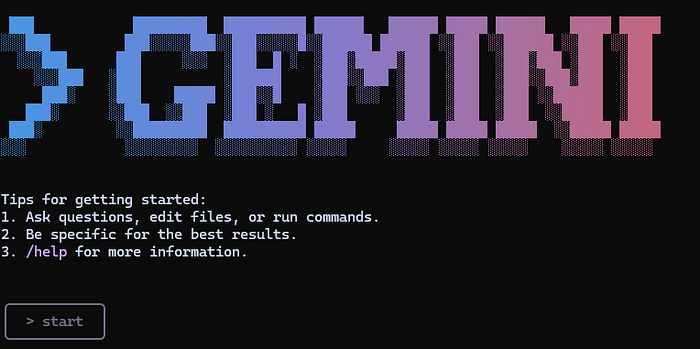
结果如上图所示。底部的矩形框是 Gemini 要求您输入指令的地方。如您所见,我只需输入“start”。这足以提示 Gemini 按照 GEMINI.md 中的指令进行操作,它会返回以下内容:
✦ Okay, let's start. First, I'll examine the dataset to propose an
analysis plan.
 ╭──────────────────────────────────────────────────────────────────────────╮
 │ ✔  ReadFile data\life-expectancy.csv                                     │
 │                                                                          │
 │    (truncated)                                                           │
 ╰──────────────────────────────────────────────────────────────────────────╯
✦ Based on the data, I propose the following analysis plan:


   1. Load Data: Read the life-expectancy.csv file.
   2. Data Cleaning: Sanitize column names for easier use.
   3. Data Exploration & Visualization:
       * Display a summary of the dataset.
       * Create an interactive world map showing the most recent life expectancy for each
         country.
       * Plot the global average life expectancy trend over time.
       * Allow users to select a country to see its specific life expectancy trend.
       * Enable comparison of life expectancy trends between multiple countries.


  Does this plan work for you? I can also modify it based on your suggestions.
我打算采用这个方案,但我只对 1900 年以后的数据感兴趣,所以我输入了这段代码。
Yes, this is fine but we are only interested in dates from the year 1900 Gemini 回复:
✦ Great, I'll incorporate that change. I will now set up the environment
and generate the Streamlit application. First, I'll create a virtual
environment.
我不会打印所有提示,但 Gemini 需要用户的许可才能在流程的每个步骤中执行命令或更改代码,因此它会询问是否可以创建虚拟环境。
 ?  Shell uv venv ←                                                                       │
 │                                                                                          │
 │   uv venv                                                                                │
 │                                                                                          │
 │ Allow execution?                                                                         │
 │                                                                                          │
 │ ● Yes, allow once                                                                        │
 │ ○ Yes, allow always "uv ..."                                                             │
 │ ○ No (esc)
我按下回车键,选择默认选项。
它继续提示我允许它安装库,完成后,它会生成并运行应用程序。
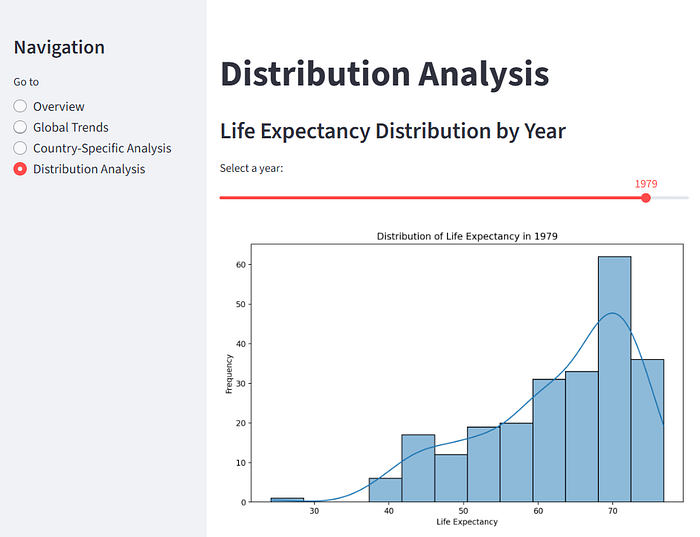
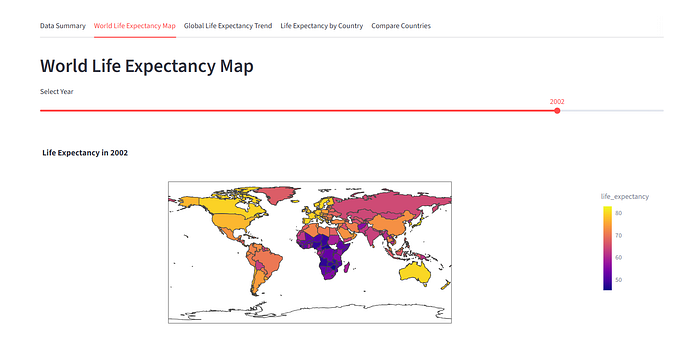
生成的应用程序会自动在浏览器中运行,如下所示。
它很好地生成了一个交互式应用程序,让我们可以探索数据。您可以在下面看到其他视图的缩略图。

现在,如果您眯起眼睛,您会在“数据摘要”面板中看到一个错误。主表只显示了数据框的头部。由于 Streamlit 允许滚动表格,因此最好显示整个数据集。
因为我要求它在单独的进程中运行应用,所以我的 Gemini 窗口仍然处于活动状态,因此我可以随时进行修改。我请求它:
> The data table in the data summary panel only shows the head of the data
frame.
Please change it so that the whole data set is included and ensure that that
the table is scrollable so that it fits nicely in that panel.
它进行了必要的(简单)更改,应用也随之更新。
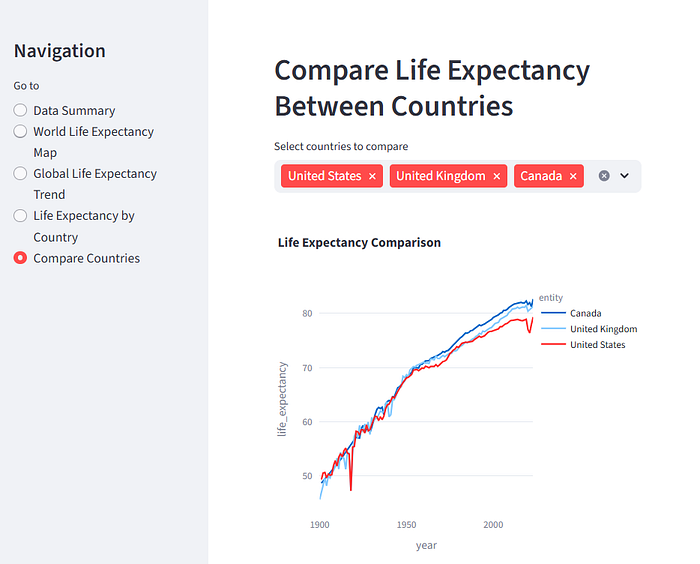
不如来点更具挑战性的修改?我要求 Gemini 替换侧面板导航,使不同的视图位于不同的选项卡中。几秒钟内,我就运行了一个新版本的应用:
3、结束语
GEMINI.md 使 Gemini CLI 成为一个非常强大的工具。我们在这里看到了如何让 Gemini 提出前进的方向,允许修改该计划,执行该计划,运行生成的应用,并在需要时允许进一步修改。所有这些都只需简单的命令,几秒钟即可完成。
您的需求可能有所不同。也许您有一个固定的方法,想要应用于任何数据分析任务。那么,您只需在 GEMINI.md 文件中指定它即可。
如果您更喜欢使用 matplotlib,或者不想使用 uv,只需指定您想要的方法,我们就会帮您搞定。
进一步此外,您还可以拥有 GEMINI.md 文件的层级结构。这将允许您指定一组通用指令来定义内部样式,同时编写仅适用于特定任务或任务组的低级指令。
我感觉我很快会再次讨论这个话题。
原文链接:One Command to Turn Any CSV into a Streamlit App with Gemini CLI
汇智网翻译整理,转载请标明出处