基于A2UI的量化交易仪表盘
谷歌的 A2UI 于几天前发布,将于 2025 年 12 月正式上线,它正在重塑 AI 智能体实时设计和构建用户界面的方式。学习如何使用 A2UI 构建自动生成的交易仪表盘
微信 ezpoda免费咨询:AI编程 | AI模型微调| AI私有化部署 | Tripo 3D | Meshy AI
想象一下,你只需告诉 AI 代理为你的交易组合生成一个实时波动率仪表盘,它就能提供一个界面精美、原生感十足的仪表盘,包含图表、滑块和实时更新。告别与静态工具或僵化框架的斗争,A2UI 让代理掌控一切。
我将深入剖析 A2UI 的本质,它为何能为量化交易者带来变革,其高效运行背后的数学原理,以及一个构建你自己的交易仪表盘的 Python 实战教程,它在金融领域的实际应用,并展望未来的发展方向。让我们开始吧!
1、赋能智能体,使其能够使用用户界面语言
A2UI 不仅仅是一个协议,而是一个声明式标准,它允许 AI 智能体动态生成丰富的交互式用户界面。该项目旨在解决智能体系统的一个核心痛点:远程 AI 智能体(通常由大型语言模型 (LLM) 驱动)如何创建在宿主应用程序中感觉原生且安全的用户界面?A2UI 不使用智能体推送可执行代码(这会带来安全隐患),而是使用结构化的 JSON 格式来描述用户界面组件、布局和行为。客户端应用程序随后会以原生方式渲染这些内容,无论是在 Web、移动设备还是桌面设备上。

A2UI 的核心是智能体到智能体 (A2A) 传输协议。A2A 负责智能体之间的安全通信,而 A2UI 则专注于用户界面有效负载。这种分离方式保持了模块化:智能体通过 A2A 进行协作,然后通过 A2UI 交付用户界面规范。对于量化仪表盘而言,这意味着代理可以分析市场数据、发现趋势,并即时生成自定义视图,例如资产相关性热图或根据您的查询量身定制的实时风险模拟器。谷歌的时机把握得恰到好处,与2025年智能体人工智能的爆发式增长相吻合,届时界面需要像它们所显示的数据一样动态演进。
2、从纯文本代理到用户界面大师
传统的量化工具,例如基于Python的交易平台中的工具,通常会将您限制在预定义的仪表盘中。想要添加新的波动率指标?您又得编写HTML、CSS代码,或者费力地使用Dash或Streamlit等库。A2UI彻底颠覆了这一现状,它赋予代理根据上下文自主设计和更新用户界面的能力。由语言学习模型 (LLM) 驱动的代理可以解读自然语言请求(例如,“为我构建一个用于监控苹果期权波动率的仪表盘”),并输出 JSON 规范,客户端会将其渲染成交互式元素,例如用于模拟的按钮、用于时间序列数据的图表或用于参数调整的表单。
这项革命性技术的关键在于其安全性和灵活性。通过发送声明式数据而非代码,A2UI 避免了注入攻击,并允许客户端强制执行其自身的组件目录和样式。在金融领域,这意味着可以创建符合规范且具有品牌标识的仪表盘,这些仪表盘能够实时调整而无需重新部署应用程序。开发人员可以节省大量时间,因为代理会处理繁重的工作,而最终用户则可以获得直观的体验。根据最近的基准测试,早期采用者报告称,在代理驱动的应用程序中,迭代速度提高了高达 50%。对于量化分析师而言,这意味着从数据处理转向战略洞察,用户界面 (UI) 会随着市场状况而不断演进。
3、UI 生成链中的延迟优化
在量化交易中,效率至关重要,毫秒级的时间都至关重要。 A2UI 的数学模型专注于最小化代理到 UI 管道中的延迟,尤其是在与 A2A 串联以构建多代理工作流时。考虑以下场景:一个代理获取市场数据,另一个代理分析数据,第三个代理生成 UI 规范。总延迟 L 的模型如下:

其中,n 为代理跳转次数,ti 为每次跳转的处理时间(例如,数据获取耗时 200 毫秒,分析耗时 150 毫秒),trender 为客户端渲染时间(通常小于 50 毫秒)。A2UI 通过增量更新进行优化:代理无需进行完整的重新渲染,而是通过引用组件 ID 来修补更改,从而在动态仪表板中将 trendert_{render}trender 的延迟降低高达 80%。
对于并行操作,请使用 max 函数代替 sum 函数:

在波动率监控中,应用排队论:响应时间 ti=1μ−λt_i,其中服务速率 μ 因 A2UI 对组件目录的缓存而提升。这确保了低于 100 毫秒的更新,这对高频交易模拟至关重要。
4、使用 Python 和 A2UI 构建量化交易仪表盘
让我们看看多代理架构如何增强可扩展性,以及您可以如何根据自己的量化策略进行调整。此架构用于监控股票波动性和投资组合风险,但您可以将其视为一个蓝图:您可以将其扩展到算法回测或新闻源情绪分析。
核心思想是多代理系统,其中专门的代理负责处理不同的任务,例如数据获取、分析和 UI 生成,并且彼此之间可以无缝通信。这模拟了现实世界的量化流程,其中模块化设计可以防止瓶颈并允许轻松替换(例如,用专有 API 替换 yfinance)。我们将使用异步 HTTP 模拟代理之间的 A2A 通信,以保持其轻量级和生产就绪状态。

在编写代码之前,为了更好地理解整个流程:想象一个流程图,用户查询从顶部进入,流向“数据代理”节点以获取市场信息,然后分支到“分析代理”进行波动率和风险评分等计算,最后汇聚到“UI代理”输出 A2UI JSON 规范。最终,客户端渲染器将该规范转换为交互式网页。这种流程确保了效率:如果市场波动剧烈,各个代理可以并行运行,仅更新仪表盘中发生变化的部分。
搭建环境
在开始编写代码之前,请确保您的环境设置正确。本教程并非入门级教程,因此我们假设您已具备一定的 Python 基础,但我会解释一些细节。
- Python 3.10+:我们需要异步功能来实现非阻塞 I/O,这在交易中至关重要,因为等待数据可能会错失交易机会。如有需要,请从 python.org 下载。
- 安装软件包:运行
pip install google-generativeai flask lit yfinance aiohttp。 - API 密钥:将
GEMINI_API_KEY设置为环境变量。前往 Google AI Studio,创建一个密钥并导出(例如,export GEMINI_API_KEY=your_key_here)。这样可以避免硬编码密钥。
步骤 1:构建 A2UI 代理 — UI 生成核心
我们的第一个代理专注于创建 A2UI JSON 规范。A2UI 的精髓在于其声明式特性:它不使用命令式代码(例如,“在这里画一条线”),而是描述 UI 应该是什么样子(例如,“包含此数据的折线图”)。客户端会解析此 JSON,从而确保安全性。
我们将使用 Gemini 定义用于数据获取(异步以提高速度)和规范生成的函数。提示符会引导 LLM 输出有效的 JSON,其中包含用户查询和数据。
import google.generativeai as genai
import json
import yfinance as yf
import numpy as np
import asyncio
import aiohttp
import os  # Added for env var handling

# Configure Gemini with API key from env for security
genai.configure(api_key=os.getenv('GEMINI_API_KEY'))
if not os.getenv('GEMINI_API_KEY'):
    raise ValueError("GEMINI_API_KEY not set in environment.")

async def fetch_market_data(ticker='AAPL', period='1mo'):
    """
    Asynchronously fetches historical market data for a ticker.
    - ticker: Stock symbol (e.g., 'AAPL' for Apple).
    - period: Time frame (e.g., '1mo' for one month).
    Returns a dict with prices list and annualized volatility.
    Handles errors gracefully for robust trading apps.
    """
    try:
        stock = yf.Ticker(ticker)
        hist = await asyncio.to_thread(stock.history, period=period)  # Offload blocking IO to thread
        if hist.empty:
            raise ValueError(f"No data for {ticker} in period {period}.")
        prices = hist['Close'].values
        # Calculate annualized volatility: Std dev of daily returns * sqrt(252 trading days/year)
        daily_returns = np.diff(prices) / prices[:-1]
        volatility = np.std(daily_returns) * np.sqrt(252)
        return {'prices': prices.tolist(), 'volatility': volatility}
    except Exception as e:
        raise ValueError(f"Data fetch error for {ticker}: {str(e)}")

def generate_a2ui_spec(data, user_query):
    """
    Uses Gemini LLM to generate A2UI JSON spec.
    - data: Dict from fetch_market_data.
    - user_query: Natural language request (e.g., "Show volatility and price chart for AAPL").
    Ensures output is secure and declarative.
    """
    model = genai.GenerativeModel('gemini-1.5-pro')  # Pro model for better JSON handling
    prompt = f"""
    You are an A2UI expert. Generate a valid JSON spec for a trading dashboard based on the user query: "{user_query}".
    Incorporate this data: {json.dumps(data, indent=2)}.
    Use these components:
    - Container: For layout (properties: layout='vertical' or 'horizontal').
    - Card: For summaries (properties: title, content).
    - LineChart: For visualizations (properties: data as list of dicts with x, y, values).
    - Button: For interactions (properties: label, onClick as action string).
    Structure: A dict with 'components' key, a list of dicts each with 'id', 'type', 'properties', optional 'children' (list of child IDs).
    Make it declarative and secure—no executable code. Use placeholders like {{volatility}} in content for data interpolation.
    Output ONLY valid JSON, no extra text.
    """
    response = model.generate_content(prompt)
    try:
        spec = json.loads(response.text.strip())  # Strip to avoid LLM extras
        # Basic validation: Ensure 'components' exists and is list
        if not isinstance(spec.get('components'), list):
            raise ValueError("Invalid spec structure.")
        return spec
    except json.JSONDecodeError as e:
        raise ValueError(f"LLM returned invalid JSON: {str(e)}")

# Example spec for testing (interpolate data manually if needed)
example_spec = {
    "components": [
        {"id": "root", "type": "Container", "properties": {"layout": "vertical"}, "children": ["summary_card", "price_chart", "refresh_button"]},
        {"id": "summary_card", "type": "Card", "properties": {"title": "Volatility Summary", "content": "Annualized Vol: {{volatility:.2f}}%"}},
        {"id": "price_chart", "type": "LineChart", "properties": {"data": [{"x": "Dates", "y": "Prices", "values": [/* prices here */]}]}},
        {"id": "refresh_button", "type": "Button", "properties": {"label": "Refresh Data", "onClick": "refresh_action"}}
    ]
}
带有 ID 的扁平列表允许创建层级式 UI,避免嵌套混乱,从而提高渲染效率。对于量化应用,可以稍后添加更多组件,例如用于相关性分析的热图。数据流的工作原理如下:

步骤 2:使用模拟 A2A 传输创建多代理链
现在,让我们来看看多代理的奥秘。我们将构建三个代理:
- 数据代理:异步获取原始市场数据。
- 分析代理:一个 Flask 端点,用于计算风险评分等指标(例如,平均价格/波动率,简单的夏普比率)。
- UI 代理:根据分析输出生成 A2UI 规范。
通信使用异步 HTTP 来模拟 A2A——在端点之间发布数据以实现解耦。在生产环境中,请替换为真正的 A2A 协议,以实现安全、标准化的代理网络。
构建多代理模型:
- 定义角色:数据代理用于输入,分析代理用于计算,UI 代理用于输出。
- 按顺序异步链接它们:数据代理 -> 分析代理 -> UI 代理。
- 为了实现并行性:如果任务独立(例如,获取多个股票代码),请使用 asyncio.gather。
- 错误容错:在所有地方使用 try-except 语句,并对不稳定的 API 进行重试。
async def a2a_chain(ticker, session, max_retries=3):
    """
    Orchestrates multi-agent chain with retries.
    - ticker: Stock symbol.
    - session: aiohttp ClientSession for shared connections.
    - max_retries: For handling transient errors.
    Simulates A2A by posting between agents.
    """
    for attempt in range(max_retries):
        try:
            data = await fetch_market_data(ticker)
            # Post to Analysis Agent (simulated A2A)
            async with session.post('http://localhost:5002/analyze', json={'data': data}, timeout=10) as res:
                if res.status != 200:
                    raise RuntimeError(f"A2A failure: Status {res.status}")
                analysis = await res.json()
            return analysis
        except Exception as e:
            if attempt == max_retries - 1:
                raise
            await asyncio.sleep(2 ** attempt)  # Exponential backoff

# Analysis Agent Server (run in separate process or terminal)
from flask import Flask, request, jsonify

app = Flask(__name__)

@app.route('/analyze', methods=['POST'])
def analyze():
    """
    Analysis Agent: Computes advanced metrics.
    Input: {'data': {'prices': [...], 'volatility': float}}
    Output: Adds 'risk_score', perhaps more like correlations if extended.
    """
    try:
        input_data = request.json['data']
        prices = np.array(input_data['prices'])
        volatility = input_data['volatility']
        # Simple risk metric: Mean return / volatility (annualized Sharpe proxy, assuming risk-free=0)
        mean_return = np.mean(np.diff(prices) / prices[:-1]) * 252
        risk_score = mean_return / volatility if volatility != 0 else 0
        # Extend here: Add portfolio beta if multiple tickers
        return jsonify({'risk_score': risk_score, **input_data})
    except KeyError as e:
        return jsonify({'error': f"Missing data: {str(e)}"}), 400

if __name__ == '__main__':
    app.run(port=5002, debug=True)  # Debug for dev, remove in prod
步骤 3:编排 A2UI 规范的生成和发送
整合:主函数运行链,生成规范,并将其发送给渲染器。
async def main(user_query="Build volatility dashboard for AAPL"):
    """
    Full orchestration: Query -> Chain -> Spec -> Render.
    Extracts ticker from query (simple parse; use NLP for complex).
    """
    # Simple ticker extraction; in prod, use regex or LLM
    ticker = user_query.split()[-1].upper() if user_query.split()[-1].isalpha() else 'AAPL'

    async with aiohttp.ClientSession() as session:
        try:
            analysis = await a2a_chain(ticker, session)
            spec = generate_a2ui_spec(analysis, user_query)
            # Post spec to Renderer (simulated client)
            async with session.post('http://localhost:5003/render', json=spec, timeout=10) as res:
                if res.status == 200:
                    print("Dashboard rendered successfully! Access at http://localhost:5003/dashboard")
                else:
                    error_text = await res.text()
                    print(f"Rendering error: {error_text}")
        except Exception as e:
            print(f"Pipeline error: {str(e)}")

# Client Renderer Server (run separately)
from flask import Flask, request, jsonify
import json  # For data handling

app = Flask(__name__)

@app.route('/render', methods=['POST'])
def render_a2ui():
    """
    Renderer Agent: Parses A2UI spec to HTML.
    In prod, use Lit/Flutter for native rendering.
    Handles interpolation (e.g., {{volatility}}).
    """
    spec = request.json
    try:
        # Basic interpolation: Replace {{key}} with data from spec
        def interpolate(text, data):
            for key, val in data.items():
                text = text.replace(f"{{{key}}}", str(val))
            return text

        html = "<html><head><script src='https://cdn.jsdelivr.net/npm/chart.js'></script></head><body>"
        components = {comp['id']: comp for comp in spec['components']}
        root = components['root']

        # Recursive render function for hierarchy
        def render_comp(id, data={}):
            comp = components[id]
            props = comp['properties']
            html_part = ""
            if comp['type'] == 'Container':
                html_part += f"<div style='display: {'flex' if props['layout'] == 'horizontal' else 'block'}'>"
                for child_id in comp.get('children', []):
                    html_part += render_comp(child_id, data)
                html_part += "</div>"
            elif comp['type'] == 'Card':
                content = interpolate(props['content'], data)  # Use analysis data
                html_part += f"<div style='border:1px solid #ccc; padding:10px; margin:10px;'>{props['title']}: {content}</div>"
            elif comp['type'] == 'LineChart':
                chart_data = props['data'][0]['values']  # Assume single dataset
                html_part += "<canvas id='chart' width='400' height='200'></canvas>"
                html_part += "<script>new Chart(document.getElementById('chart'), {type: 'line', data: {labels: Array.from({length: " + str(len(chart_data)) + "}, (_, i) => i+1), datasets: [{label: '" + props['data'][0]['y'] + "', data: " + json.dumps(chart_data) + ", borderColor: 'blue'}]}});</script>"
            elif comp['type'] == 'Button':
                html_part += f"<button onclick='alert(\"{props['onClick']}\")'>{props['label']}</button>"  # Simple alert; in prod, tie to callbacks
            return html_part

        html += render_comp('root', analysis)  # Pass analysis data for interp
        html += "</body></html>"

        with open('dashboard.html', 'w') as f:
            f.write(html)
        return jsonify({'status': 'success'})
    except KeyError as e:
        return jsonify({'error': f"Invalid spec: {str(e)}"}), 400

@app.route('/dashboard')
def show_dashboard():
    try:
        with open('dashboard.html', 'r') as f:
            return f.read()
    except FileNotFoundError:
        return "Dashboard not generated yet.", 404

if __name__ == '__main__':
    app.run(port=5003, debug=True)
启动服务器:分析服务器运行在 5002 端口,渲染服务器运行在 5003 端口。然后运行 asyncio.run(main())。打开 localhost:5003/dashboard 进行测试,即可查看交互式 UI!
步骤 4:运行、测试和扩展到生产环境
您已完成所有步骤,现在是时候让一切运转起来了。在这一步中,我将介绍如何运行您构建的系统,对其进行全面测试以确保其能够处理真实的量化场景,并将其扩展到生产环境。
首先,让我们可视化您创建的端到端流程。以下是多代理管道的概念流程图:

启动服务器:打开三个独立的终端窗口(或使用 tmux 等工具进行多路复用)。在第一个窗口中,导航到您的项目目录并运行分析代理。这将启动端口 5002 上的 Flask 服务器,监听数据请求。在第二个终端中,启动渲染器。
它会在端口 5003 上启动,准备将 A2UI 规范解析为 HTML。第三个终端用于运行主编排脚本,我们稍后会详细介绍。
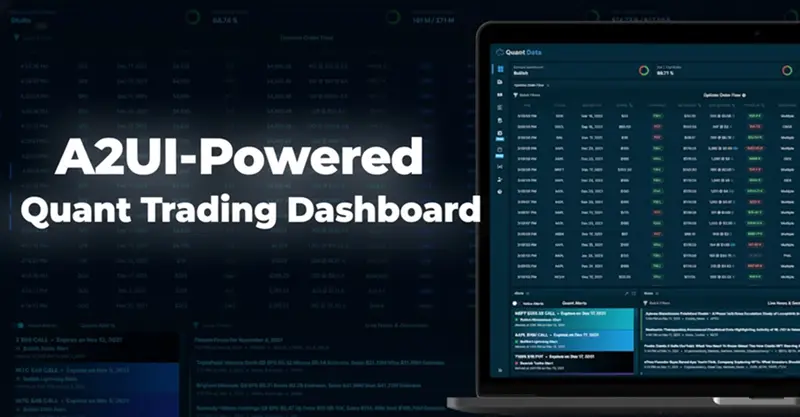
执行此操作会异步触发整个流程。请留意控制台日志——如果一切顺利,您将看到“仪表盘渲染成功!访问 http://localhost:5003/dashboard”。在浏览器中打开该 URL 即可查看交互式用户界面,其布局简洁,包含波动率汇总卡片、绘制近期价格的折线图以及一个(目前)模拟警报的刷新按钮。您可以查看仪表盘的预览图。以下示例展示了一个交互式交易用户界面,其中包含图表、卡片和按钮。您的界面将与之类似,但可通过 A2UI 进行自定义:

A2UI 的发布标志着一个关键时刻,用户界面不再是静态的约束,而是成为了智能体的动态画布。通过将 UI 逻辑与硬编码的客户端逻辑解耦,我们不仅缩短了毫秒级的延迟,更从根本上改变了开发者的工作流程。对于数据科学家和量化分析师而言,其意义深远:与僵化的前端框架搏斗的时代即将结束,取而代之的是一种全新的范式:您的模型不仅分析数据,还能构建可视化数据的工具。
原文链接:Google’s A2UI: The New Standard for Agent-Generated Interfaces
汇智网翻译整理,转载请标明出处