从零开始构建AI代理技能
代理技能通过将领域专业知识、工作流程和上下文打包成可移植的文件夹来解决这个问题,代理可以按需发现和使用它们。
微信 ezpoda免费咨询:AI编程 | AI模型微调| AI私有化部署 | OpenClaw安装
AI 代理越来越强大,但它们通常缺乏实际工作所需的专业知识。你的代理可能会写代码,但它知道你团队的部署流程吗?它可以分析数据,但它理解你公司的报告标准吗?
代理技能通过将领域专业知识、工作流程和上下文打包成可移植的文件夹来解决这个问题,代理可以按需发现和使用它们。
你将构建什么:
在本指南中,你将创建一个技能,教 AI 代理如何使用图表和洞察生成漂亮的财务报告——基于 Cameron AI,这是我们之前关于代理提示和工具设计的文章中的个人理财助手。
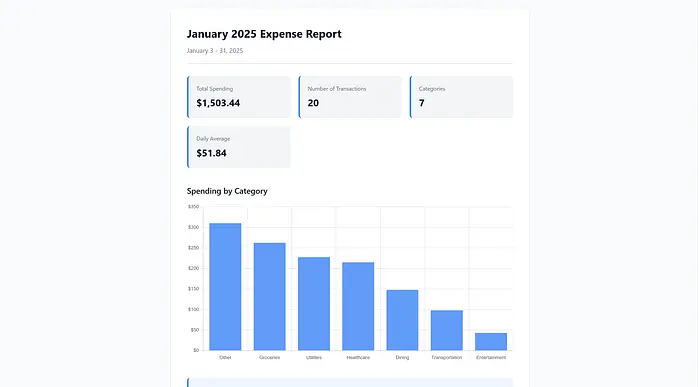
以下是你的代理使用此技能生成的报告概览:
1、什么是代理技能?
代理技能 是包含 AI 工具可以发现和使用 instructions, scripts, and resources 的文件夹。将它们视为你的 AI 助手的培训文档,不同之处在于它们在相关时会自动加载。
关键洞察是渐进式披露。当你的代理启动时,它只加载每个技能的名称和描述——每个技能约 100 个 token。这意味着你可以拥有数十个技能而不必撑大你的上下文窗口。你的代理保持快速和专注,只在需要时才拉取详细指导。
2、技能 vs MCP:互补而非竞争
如果你使用过 MCP 服务器,你可能想知道技能如何融入。以下是区别:
代理技能
- 目的:教授工作流程和知识
- 格式:单个 SKILL.md 文件
- 示例:"如何写代理提示"
MCP 服务器
- 目的:提供工具和功能
- 格式:服务器代码(TypeScript、Python)
- 示例:"获取 URL"、"查询数据库"
技能提供知识;MCP 提供功能。技能可能指示代理"获取 API 文档并分析它",而 MCP 服务器提供实际的 fetch 工具。
要深入了解,请参阅官方代理技能规范。
3、理解 SKILL.md 格式
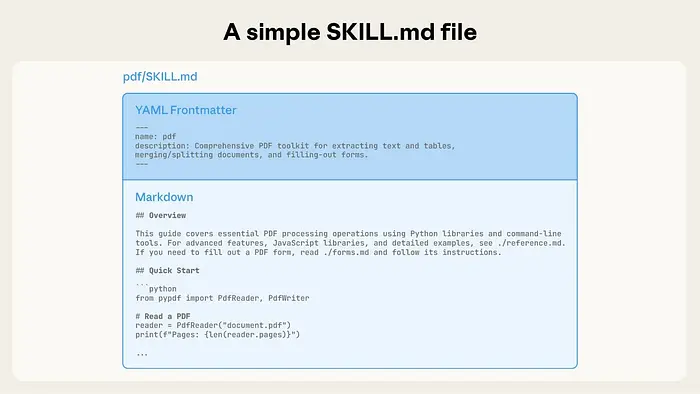
每个技能都是一个包含 SKILL.md 文件的文件夹。该文件有两部分:YAML 头部和 markdown 指令。
必填字段
name- 64 个字符,小写字母、数字和连字符description- 1024 个字符,使用此技能的原因和时间
description 至关重要,这是 AI 用来决定何时激活你的技能。包含与用户自然寻求帮助方式匹配的具体关键词。
注意:规范支持额外的可选字段(license、compatibility、allowed-tools等)。请参阅官方文档获取完整列表。
4、构建 Cameron Expense Reporter 技能
让我们为 Cameron AI 构建一个技能,Cameron AI 是一个帮助用户管理预算和跟踪支出的个人理财助手。
为简单起见,我们假设 Cameron 通过 MCP 具有文件系统访问权限,并且可以在沙盒环境中执行 JavaScript——这是发现和运行技能所需的基础设施。
我们正在构建的技能将教 Cameron 如何使用 Chart.js 将原始支出数据转换为专业可视化。
你将构建什么:一个包含以下内容的完整技能:
- 6 步可视化工作流(理解请求 → 收集数据 → 格式化 → 生成图表 → 添加洞察 → 撰写报告)
- Chart.js 配置和数据格式化的辅助脚本
- 图表类型选择参考指南
- 专业报告的 HTML 模板
完整实现:完整技能可在 GitHub 上获取。我们将在此处展示函数签名和关键模式。
步骤 1:创建技能目录
为你的技能创建文件夹结构:
mkdir -p my-skills/cameron-expense-reporter
cd my-skills/cameron-expense-reporter

# 为支持文件创建子目录
mkdir -p scripts references assets
此技能将使用:
- scripts/:用于图表和数据格式化的可重用 JavaScript 工具
- references/:决策指南和完整示例
- assets/:用于专业输出的 HTML 模板
步骤 2:编写头部
创建带有头部的 SKILL.md,清楚地描述何时激活此技能:
---
name: cameron-expense-reporter
description: Generate financial reports with charts using Chart.js. Use when users ask to visualize spending, show trends, create expense charts, analyze spending patterns, compare categories, track budget progress, or generate financial reports. Handles chart type selection (bar/line/pie), data formatting (currency, dates, aggregation), Chart.js configuration, and insight generation. Works with expense data from tools like cameron_get_expenses or similar financial data sources.
---
关键决策:
- name:带有明确目的的 Cameron 域范围(我们也可以只使用 expense-reporter)
- description:包含用户会说的自然触发短语("可视化支出"、"显示趋势"、"支出图表")
description 至关重要,它决定 AI 何时加载此技能。包含同义词和常用表述。
步骤 3:定义工作流
在头部之后,添加技能标题和 6 步工作流:
# Cameron Expense Reporter

Generate beautiful, insightful financial reports with charts and written analysis.

## Workflow

### Step 1: Understand the Request

Identify the user's intent to select the appropriate visualization:

- Category comparison → Bar chart
- Time-series trends → Line chart
- Distribution/proportions → Pie chart
- Budget tracking → Line chart with budget reference line

### Step 2: Gather Expense Data

Use the `cameron_get_expenses` tool to retrieve relevant data...

### Step 3: Prepare and Format Data

Use helper scripts for data transformation...

### Step 4: Generate Chart Configuration

Use helper scripts to create Chart.js configurations...

### Step 5: Generate Insights

Provide written analysis alongside the chart...

### Step 6: Compose the Report

Generate HTML, markdown, or inline visualization...
为什么是 6 步:每步代表可视化工作流中的不同决策点。这引导 AI 完成:意图识别 → 数据检索 → 转换 → 渲染 → 分析 → 输出。
步骤 4:添加支持脚本
对于复杂逻辑,将可重用函数提取到脚本中。创建两个 JavaScript 工具:
scripts/format_financial_data.js — 数据转换:
/**
 * Aggregate expenses by category
 */
function aggregateByCategory(expenses) {
  return expenses.reduce((acc, expense) => {
    const category = expense.category || 'Other'
    acc[category] = (acc[category] || 0) + expense.amount
    return acc
  }, {})
}

/**
 * Prepare expense data for visualization
 */
function prepareChartData(expenses, aggregationType = 'category', sortByValue = true) {
  let aggregated

  switch (aggregationType) {
    case 'category':
      aggregated = aggregateByCategory(expenses)
      break
    case 'month':
      aggregated = aggregateByMonth(expenses)
      break
    case 'week':
      aggregated = aggregateByWeek(expenses)
      break
  }

  if (sortByValue && aggregationType === 'category') {
    aggregated = sortByAmount(aggregated)
  }

  return toChartFormat(aggregated)
}

// Also includes: aggregateByMonth, aggregateByWeek, formatCurrency,
// calculatePercentageChange, formatDateRange, toChartFormat, sortByAmount
scripts/generate_chart_config.js — Chart.js 配置:
/**
 * Generate a bar chart configuration for categorical spending data
 */
function generateBarChart({ title, labels, data, currency = '$' }) {
  return {
    type: 'bar',
    data: {
      labels: labels,
      datasets: [
        {
          label: 'Spending',
          data: data,
          backgroundColor: 'rgba(59, 130, 246, 0.8)',
          borderColor: 'rgba(59, 130, 246, 1)',
          borderWidth: 1,
        },
      ],
    },
    options: {
      responsive: true,
      maintainAspectRatio: false,
      plugins: {
        title: { display: true, text: title, font: { size: 16, weight: 'bold' } },
        tooltip: {
          callbacks: {
            label: function (context) {
              return currency + context.parsed.y.toFixed(2)
            },
          },
        },
      },
      scales: {
        y: {
          beginAtZero: true,
          ticks: { callback: (value) => currency + value.toFixed(0) },
        },
      },
    },
  }
}

// Also includes: generateLineChart, generatePieChart
为什么使用脚本:不要将复杂逻辑内联在 SKILL.md 中,而是提取 AI 可以读取和执行的可重用函数。
完整实现:请参阅 GitHub 上的完整技能 获取所有工具函数。
步骤 5:添加参考指南
对于决策逻辑,使用 AI 按需加载的参考文档:
references/chart-types-guide.md — 图表选择决策树:
## Decision Tree

### Categorical Comparison ("Which category did I spend most on?")

**Use: Bar Chart**

Best for:

- Comparing spending across categories
- Showing top spending categories

Example queries:

- "What are my biggest expenses?"
- "Show spending by category"

### Time-Series Trends ("How is my spending changing?")

**Use: Line Chart**

Best for:

- Showing spending trends over weeks/months
- Comparing to budget over time

Example queries:

- "Show my spending trends over the year"
- "How has my spending changed?"

### Distribution/Proportions ("Where does my money go?")

**Use: Pie Chart**

Best for:

- Showing percentage breakdown
- Understanding spending distribution

Example queries:

- "Where does my money go?"
- "What percentage do I spend on dining?"
为什么使用参考:将决策指导与主工作流分离。SKILL.md 引用此指南:"For chart selection, see [references/chart-types-guide.md]"。
该技能还包括:
- references/chartjs-examples.md:每种图表类型的完整 HTML 示例
- assets/report-template.html:带占位符的专业 HTML 模板
步骤 6:在 SKILL.md 中引用支持文件
在你的工作流中,告诉 AI 何时使用这些资源:
### Step 1: Understand the Request

Identify the user's intent to select the appropriate visualization.

For detailed chart selection guidance, see [references/chart-types-guide.md](references/chart-types-guide.md).

### Step 2: Gather Expense Data

Use the `cameron_get_expenses` tool (or equivalent) to retrieve relevant data:

### Step 3: Prepare and Format Data

**Load the formatting utilities:**

<!-- Read and use scripts/format_financial_data.js -->

### Step 4: Generate Chart Configuration

**Load the chart generator:**

<!-- Read and use scripts/generate_chart_config.js -->
渐进式披露:引用文件在需要时由 AI 按需加载。你不需要将所有内容都内联在 SKILL.md 中。
步骤 7:将最佳实践添加到 SKILL.md
包含关于边缘情况和性能的指导:
## Best Practices

**Data preparation:**

- Always validate date ranges before querying
- Handle empty results gracefully
- Round currency to 2 decimal places for display

**Chart configuration:**

- Use consistent color scheme (blue primary, red for warnings)
- Set responsive: true for all charts
- Format currency in tooltips and axis ticks

**Insight generation:**

- Lead with the most important finding
- Use concrete numbers, not vague language ("Dining increased 15%" not "You spent more on dining")
- Provide context (percentages, comparisons)

**Performance:**

- For large datasets (>1000 expenses), aggregate before visualizing
- Use `response_format: 'concise'` when fetching chart data
步骤 8:验证完整技能
验证你的技能包含所有组件:
cameron-expense-reporter/
├── SKILL.md                          ✓ Main instructions with 6-step workflow
├── scripts/
│   ├── generate_chart_config.js      ✓ Bar, line, pie chart generators
│   └── format_financial_data.js      ✓ Aggregation and formatting utilities
├── references/
│   ├── chart-types-guide.md          ✓ Chart selection decision tree
│   └── chartjs-examples.md           ✓ Complete working examples
└── assets/
    └── report-template.html          ✓ HTML template for reports
验证清单:
- SKILL.md 带有清晰触发短语的头部
- 工作流是分步且可操作的
- 支持脚本有清晰的函数签名
- 引用通过相对路径从主 SKILL.md 链接
- 所有示例使用一致的模式(Chart.js v4、Tailwind 颜色)
获取完整技能: GitHub 仓库
5、测试你的技能
现在让我们安装和测试技能。
5.1 在 Claude 中安装
最快的测试方式是使用 Claude.ai 或 Claude Desktop:
注意:如果你使用最终的 GitHub 仓库技能,请在压缩并上传到 Claude 之前从技能文件夹根目录删除 expenses.csv 文件。
- 压缩你的技能文件夹:
zip -r cameron-expense-reporter.zip cameron-expense-reporter/ - 进入 Settings > Capabilities 并确保"Code execution and file creation"已启用
- 滚动到 Skills 部分并点击 Upload skill
- 上传你的 ZIP 文件
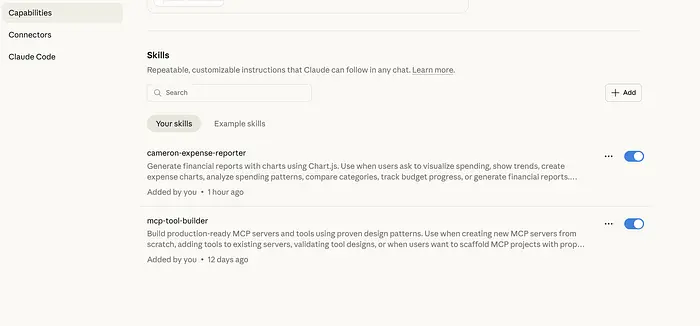
在 Claude 的设置中上传你的技能。
有关详细信息,请参阅在 Claude 中使用技能。
其他工具:你不限于 Claude,任何兼容技能的代理都可以工作。例如,在 Cursor 中,将你的技能文件夹放在.cursor/skills/中。你也可以使用 skills.sh 通过单个命令跨工具安装技能:npx skills add <owner/repo>。
5.2 使用示例数据测试
下载示例支出 CSV 并尝试以下提示:
Here are my expenses [attach the CSV file]. Can you create a report using the cameron-expense-reporter skill?
预期行为:
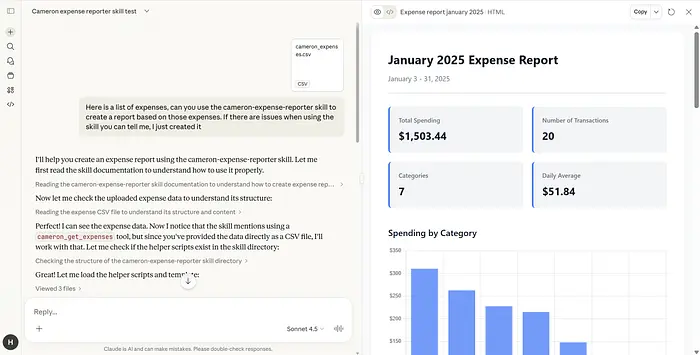
Claude 生成带条形图比较支出的报告。
- Claude 激活 cameron-expense-reporter 技能
- 读取 CSV 数据
- 选择适当的图表类型(类别比较用条形图)
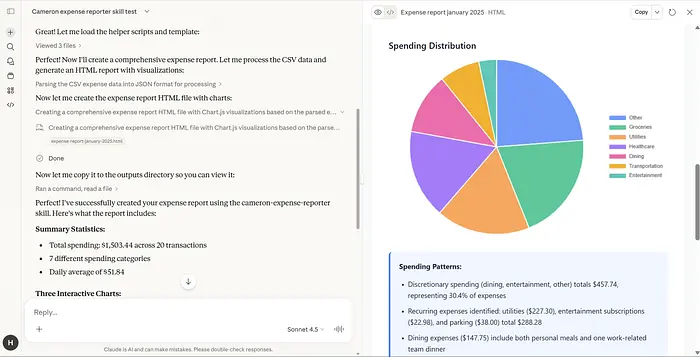
- 使用格式化数据生成 Chart.js 可视化
- 提供关于支出模式的书面洞察
- 输出完整的 HTML 报告
6、最佳实践
现在你已构建了第一个技能,以下是创建有效技能的一些技巧:
保持专注。一个技能应该很好地做一件事。如果你的 SKILL.md 超过 500 行,考虑拆分为多个技能或使用支持文件。
描述关键词很重要。description 字段决定 AI 何时激活你的技能。为你的用例包含同义词和常用表述。
**战略性地使用支持文件。**复杂技能受益于:
- scripts/:AI 可执行的可重用代码(JavaScript、Python、shell 脚本)
- references/:决策树、文档、示例(按需加载)
- assets/:模板、图像、静态文件(在输出中使用,不加载到上下文)
展示函数签名,而不是完整实现。在 SKILL.md 中,包含:
// 好:带有目的的清晰签名
function aggregateByCategory(expenses) { ... }

// 避免:内联实现
// 将实际逻辑保留在 scripts/ 目录中
在简洁性和完整性之间取得平衡。cameron-expense-reporter SKILL.md 约 290 行:
- 约 100 行:工作流步骤
- 约 100 行:最佳实践和常见模式
- 约 90 行:快速参考和故障排除
使用真实场景测试。根据你面对的实际任务运行你的技能。根据有效内容调整描述和指令。
7、使用技能创建者
我们手动构建技能以了解每个组件,但你不必这样做。Anthropic 提供了一个技能创建者技能,可以为你生成或迭代技能,只需描述你想要什么,让 AI 处理结构和格式。
8、超越教程
我们在这里构建的技能是出于学习目的。在将技能投放到生产环境或与其他用户分享之前,还有额外的考虑因素,特别是如果你正在构建自定义代理。
评估:测试你的技能在各种提示下,看代理可靠地激活它、遵循工作流并产生正确输出的程度。单一成功测试不够,边缘情况和模糊请求会揭示你指令中的空白。
上下文管理:监控技能激活时代理上下文如何增长。加载完整指令加上参考文件加上脚本可能会消耗大量 token。如果你的代理在一个会话中使用多个技能,上下文压力就成为真正的问题。
基础设施(自定义代理):像 Cursor 和 Claude Code 这样的编码工具开箱即用地处理技能发现和代码执行。对于自定义代理,你可能需要评估你的 MCP 文件服务器和沙盒是否足够健壮——特别是围绕文件访问权限、执行超时和脚本失败时的错误处理。
9、结束语
你刚刚创建了一个复杂的技能,将 Cameron AI 转变为财务可视化专家。SKILL.md 文件及其支持脚本、参考指南和模板——可以跨 Cursor、Claude Code 和任何具有适当基础设施的自定义代理工作。
这就是开放标准的力量:写一次,随处使用,无论是在编码助手还是你构建的自定义代理中。
你构建的技能展示了生产级代理技能的关键模式:
- 渐进式披露:只在需要时加载详细参考
- 可重用脚本:将复杂逻辑提取到可执行函数中
- 决策树:用于一致选择的参考指南
- 专业输出:用于精炼交付物的模板
你的代理最常重复的 工作流程是什么?那就是你的下一个技能。
原文链接: How to Build and Deploy an Agent Skill from Scratch
汇智网翻译整理,版权归原作者所有,转载需标明出处